Ed-Fi Analytics for K-12
An Early Warning System enables teachers, counselors, administrators and parents to quickly and successfully identify when a student demonstrates – through grades, assessment data, attendance, or behavior – the potential risk of falling behind in their learning, disengaging, or showing other changes in their academic/behavioral patterns. EWS visualizations that present real-time, actionable information to users based on the Balfanz model combine those domains of data plus assessment data, providing complete, role-specific views which assists the user in identifying at-risk students early and creating a targeted intervention in support of the learner.
Student Assessment
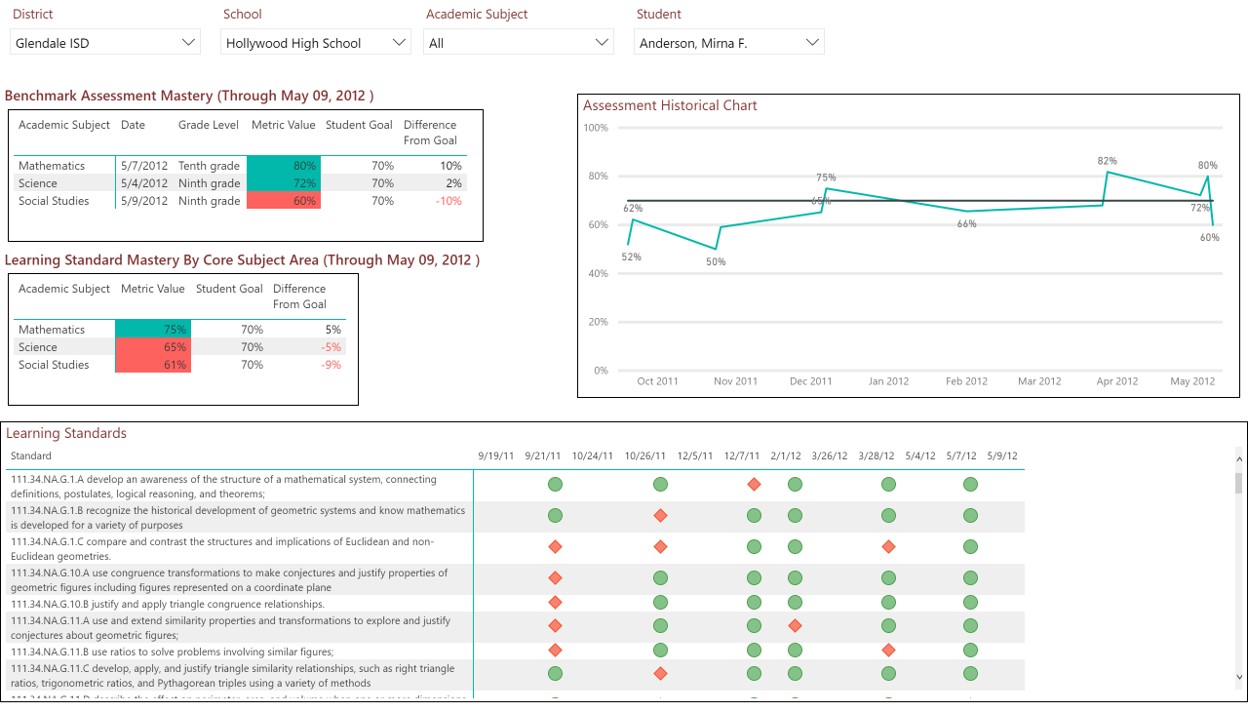
Assessment records can be a key marker of progress and achievement in a student’s educational career, and when taken into account with attendance, grades and behavior is a critical component of an Early Warning System. The ability for an educator to see, at a glance, trends in a student’s command of learning standards can be a pivot point to ensuring additional help is provided to the student as needed, when needed, so that no learner is discouraged in their journey.
Early Warning System - Student
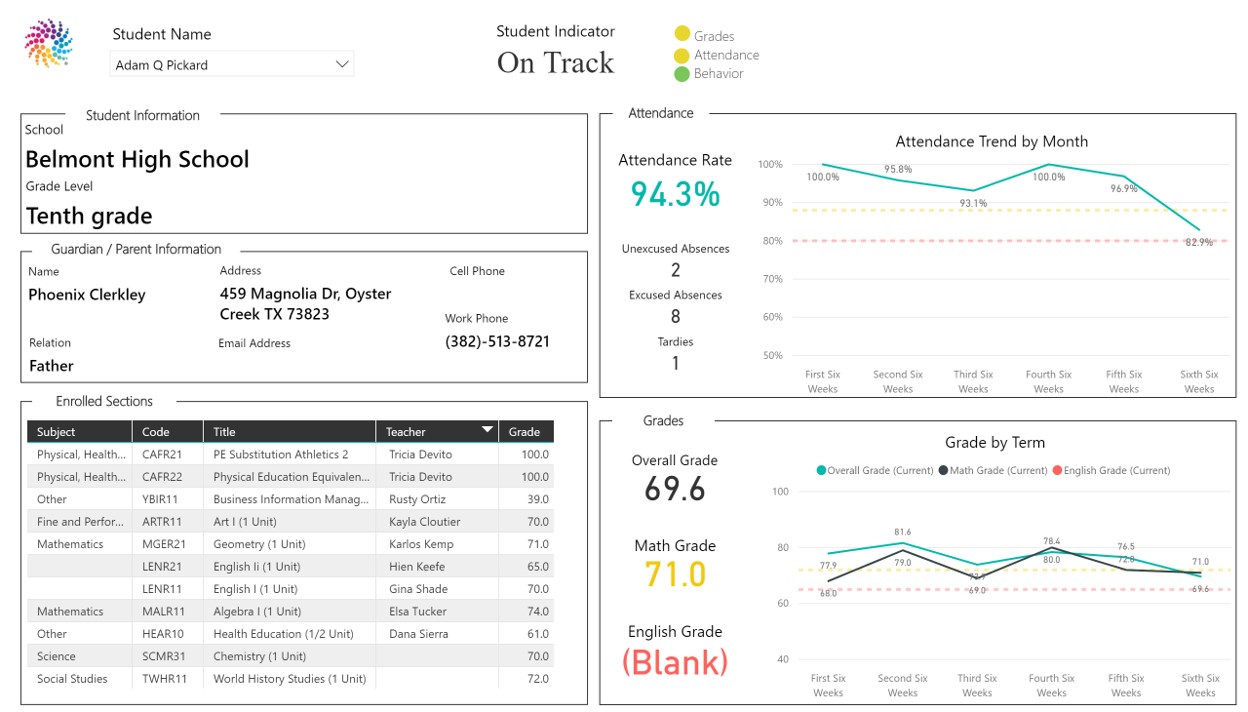
The Student EWS dashboard is the complete view of all the disparate data that make up the EWS – assessment, attendance, grading and behavior – and if any of these start to fall out of line, the EWS will trigger and make certain the student’s teacher, advisor etc are alerted to a pending change, which can then be assessed and may necessitate some form of intervention. The EWS is an incredibly powerful pre-emptive tool, enabling educators to receive timely alerts, while ensuring students do not fall behind or get lost between the cracks.
Early Warning System - Teacher and Counselor
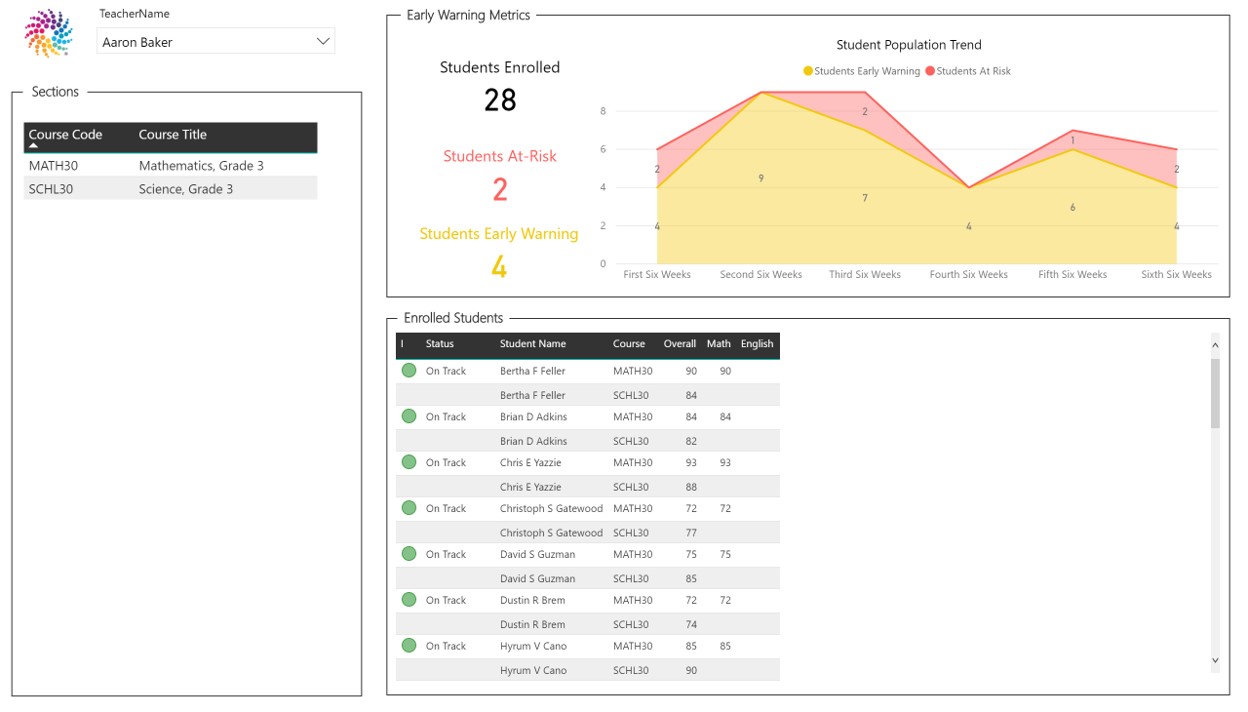
Teachers and counselors need clear, up-to-date data visualizations that quickly and easily demonstrates which of their students are doing well and which are triggering warning signs through missed attendance, low grades or discipline issues, so they can help those students course correct as quickly as possible. Having these timely visualizations gives teachers more time for working with their students and planning lessons, instead of trying to manually track each individual student’s progress.
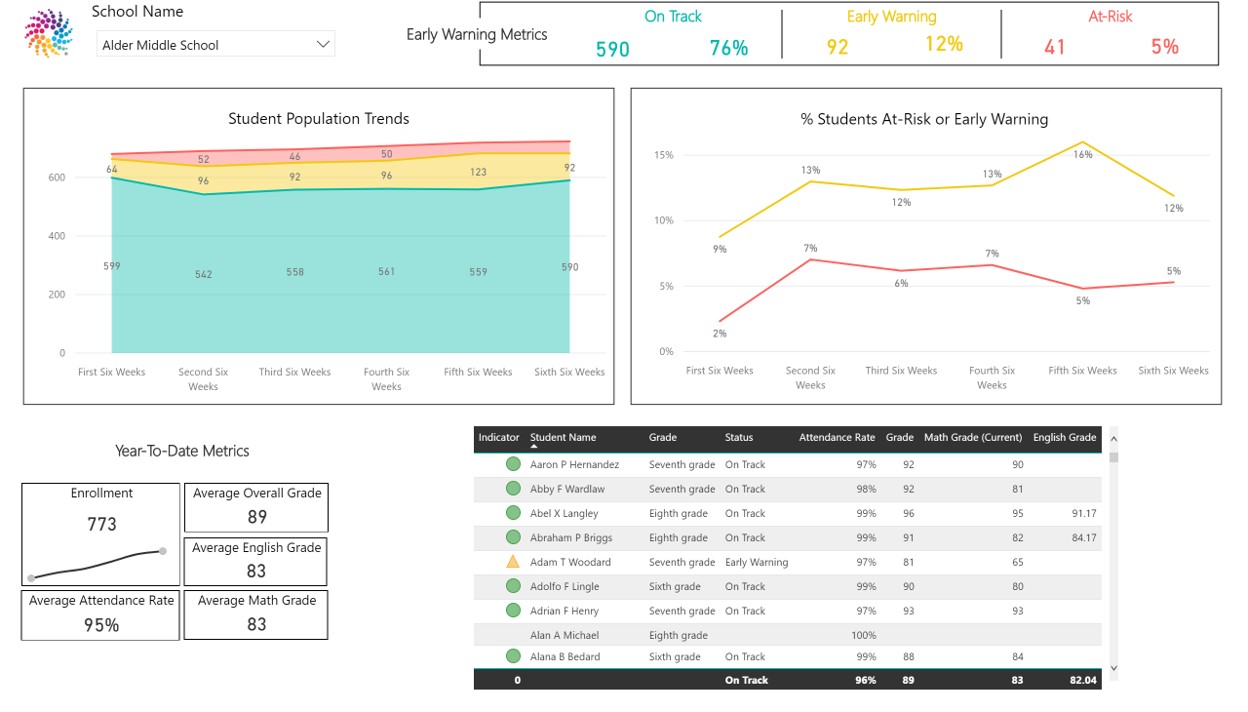
Early Warning System - Principal and School Administrator
Principals and school administrators need a complete overview of their school to track trends, prepare for assessments and see where additional resources may be needed. They also need the ability to access all teachers’ dashboard views and see details on individual students who may be needing intervention. Additionally, they need to be able to compare their school to others in their district, and evaluate their school’s programs and set and track goals for future improvements.
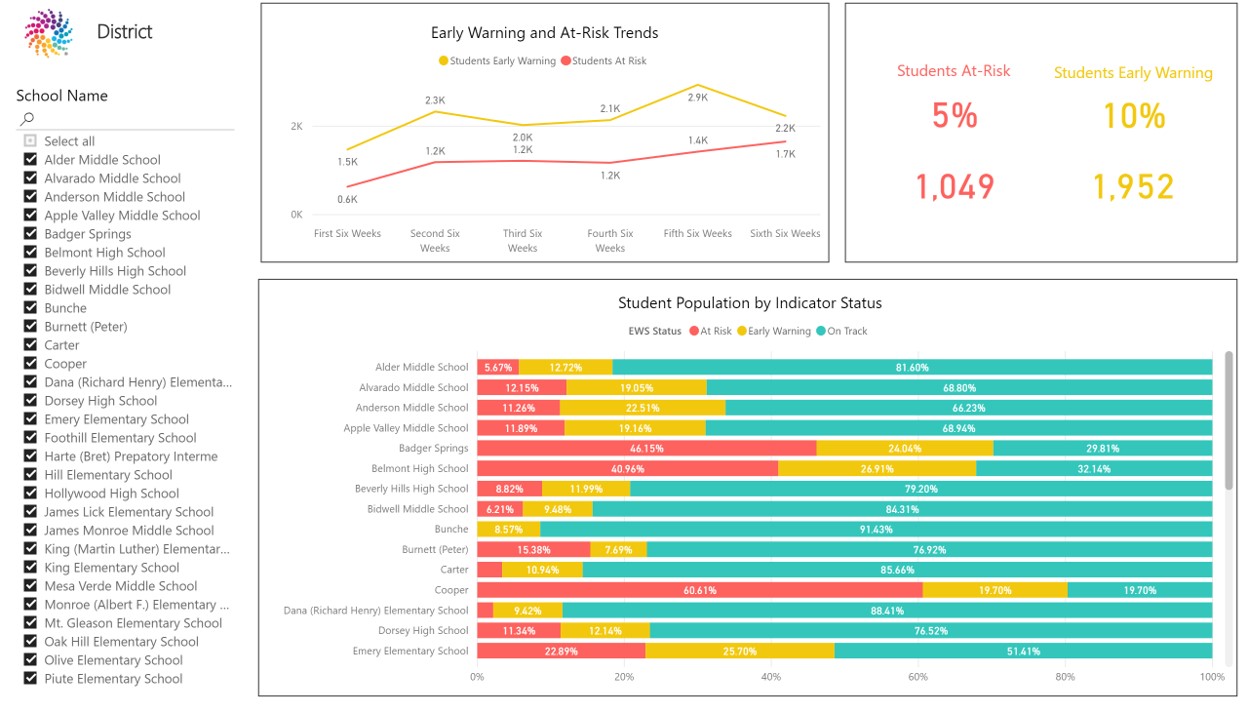
Early Warning System - District Administrator
District administrators need a district-wide view to surface patterns and trends across their campuses and program areas. They need to be able to set and track goal progress and understand where daily operations are meeting or trending away from those goals, and see clearly which schools need extra resources or programs put into place, and track the results of those programs.
Higher Education Analytics
“Using data to better understand our students and our own operations paves the way to developing new, innovative approaches for improved student recruiting, better student outcomes, greater institutional efficiency and cost-containment, and much more. Data is an institutional strategic asset and should be used as such.”AIR, Educause, NACUBO, 2019
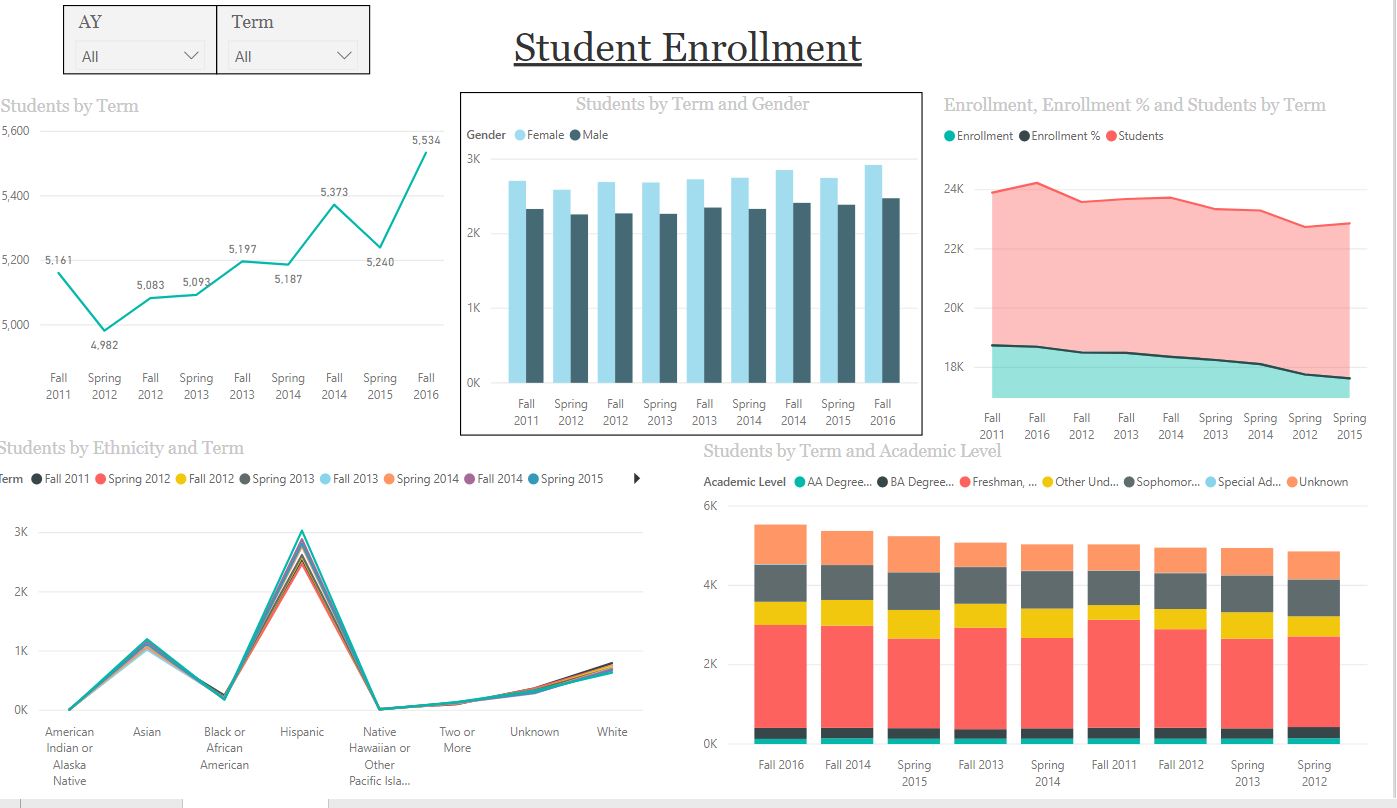
Enrollment
As more colleges and universities focus their strategic planning on student outcome initiatives and invest in student success measures, it has become essential for departments to improve their access to interactive data. These views show the complete details of your enrollment, slicing from historical views by term, discipline and ethnicity to gender splits by year, to student age counts by term. All these charts and graphs come pre-populated to get you up and running quickly and can be expanded and customized extensively.
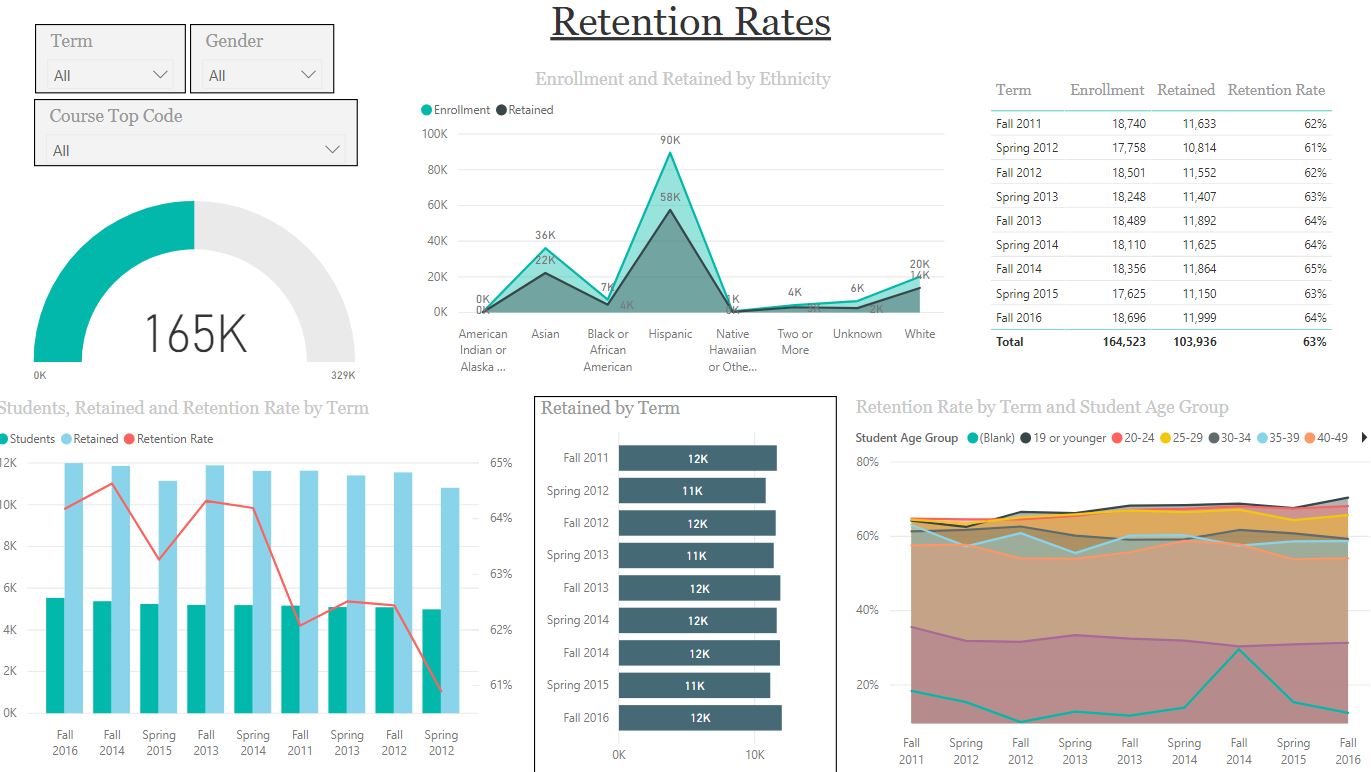
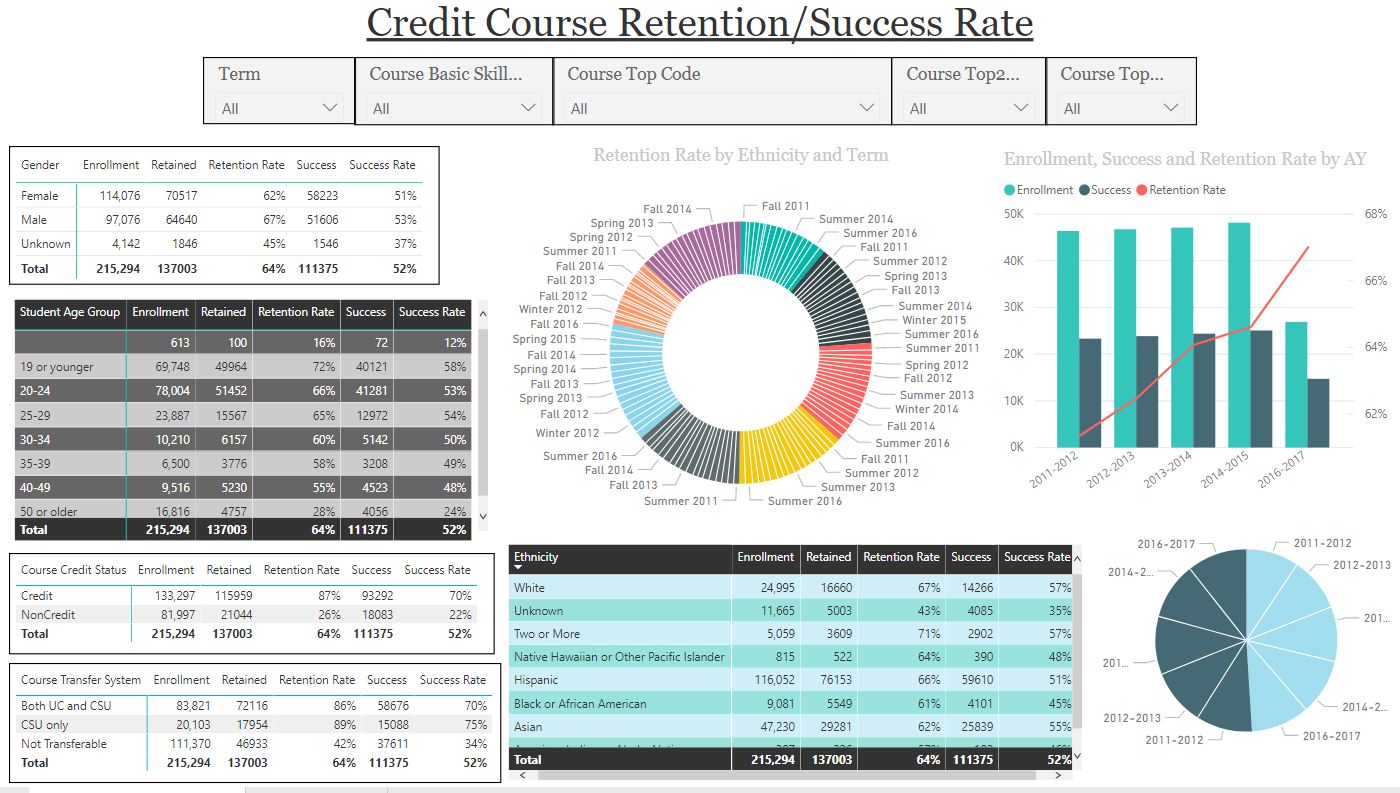
Retention and Success
Data analytics are transformational in empowering those on the front lines who are directly educating and supporting students. Our Higher Ed Analytics disaggregated views are key to seeing what’s really going on – the true data, uncovered. Without disaggregated data, you’re only seeing one picture; not what’s actually happening at the levels where you can effect change. If you want to improve the retention and success of Hispanic females age 18-24 in your Engineering Dept, or potentially offer a grant to any students with migrant worker parents, it doesn't serve your students if the only data you see is females 18-24 who ever took an engineering class.
Outcomes Distribution
Outcome views are pivotal to addressing what has occurred historically and how to plan for the future. These views allow you to see fine granular details that help you set goals and track your progress. Clicking on the different sections of the graphs will immediately filter by that category – for instance, by choosing African American ethnicity, all other charts on that view will adjust to show each data set, giving you a fast, comprehensive understanding of both current and historical trends in your college.
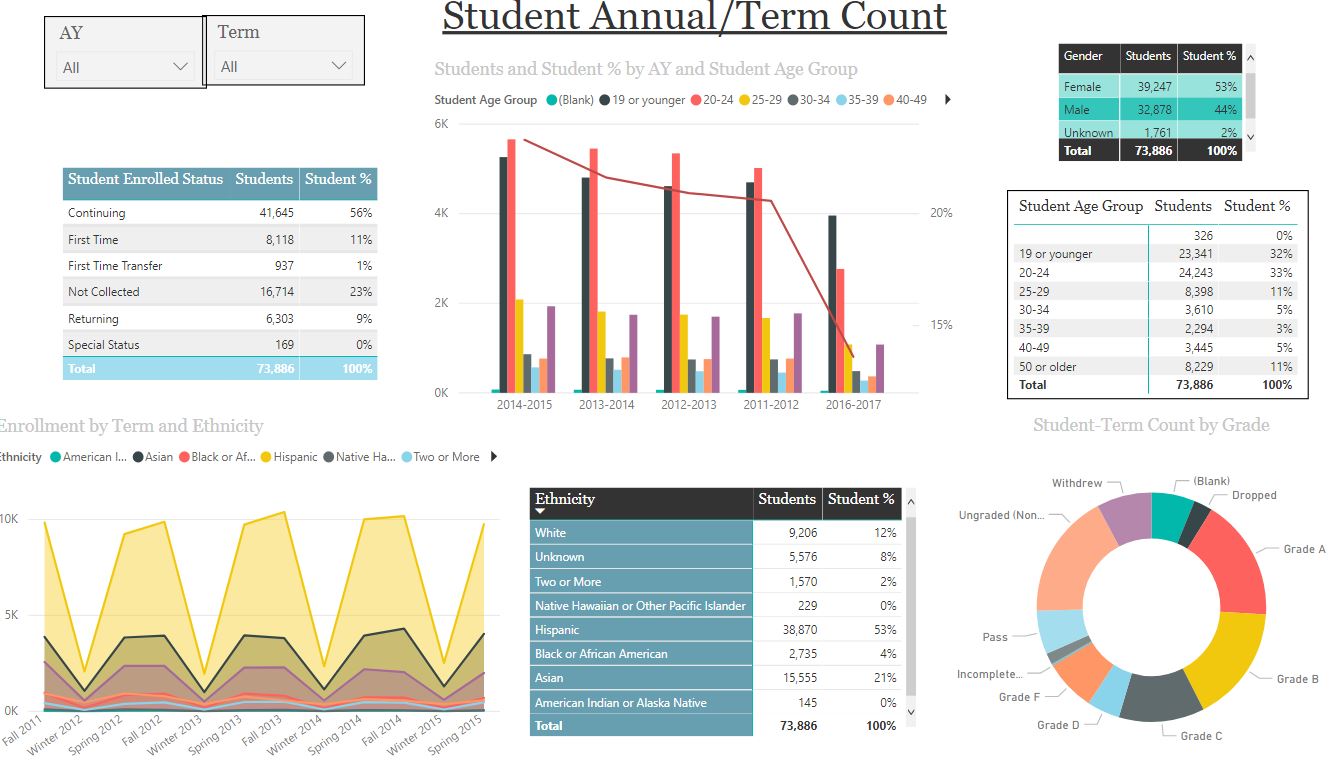
Student Demographics
Creating a culture that utilizes data-informed decisions is at the forefront of many institutional goals. Tracking success across all demographics is an integral part of improving student outcomes and demonstrating effectiveness at reaching institutional goals and ensuring higher levels of student completion and employment. These extensive student demographic views provide the details that make the difference and will help your college choose clear goals.