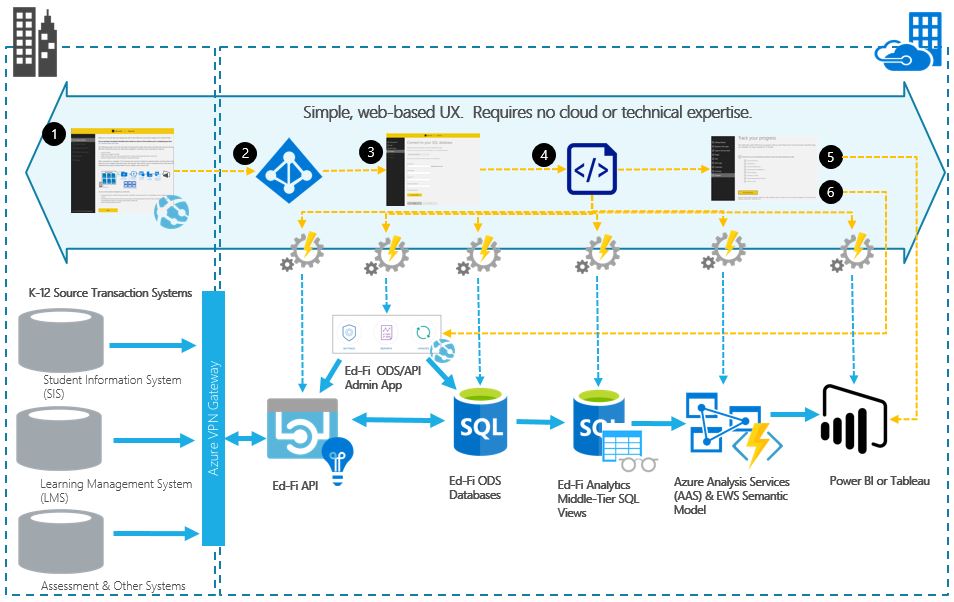
IntePort's Ed-Fi Implementation Suite for Microsoft Azure
IntePort’s Ed-Fi Implementation Suite for Microsoft Azure solution is a fully automated, end-to-end Ed-Fi solution that deploys to a Microsoft Azure platform as a service (PaaS) infrastructure in ~20 minutes with no cloud or system integration expertise required. It also deploys robust, interactive Assessment and Early Warning System analytics through Microsoft Power BI. These analytics combine SIS and standardized testing data together in pre-built yet fully customizable data models, dashboard visualizations and publishable reports that are role-specific, easy to understand and easy to securely disseminate and share.
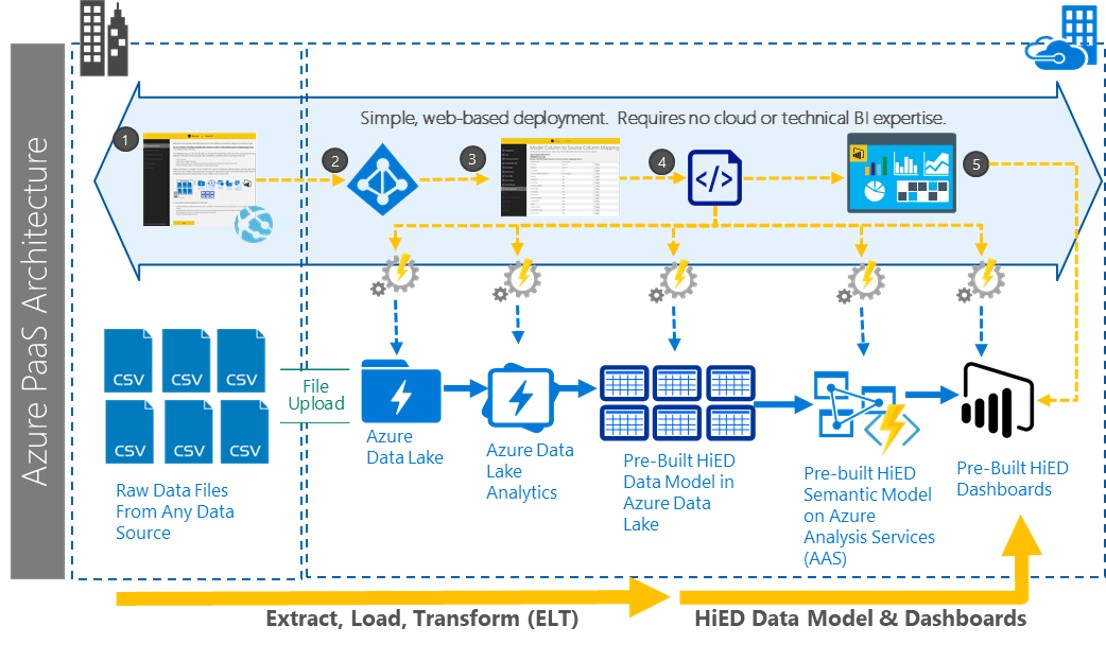
IntePort's Bring Your Own Data (BYOD) Analytics
IntePort’s BYOD analytics is a cloud-based, custom data mapping and automated data modeling and dashboard generation solution that harnesses your data in it's existing form and surfaces that data in robust Azure Analysis Services (AAS) data models that can then be leveraged to produce myriad custom reporting in Microsoft Power BI, Tableau and other modern reporting tools. The solution can convert millions of cryptic, disparate data points from multiple existing sources across your organization into compelling, informative visualizations. Custom reports that previously took weeks to manually generate can now be completed in a matter of seconds and generated directly by end-users via robust, secure self-service analytics.
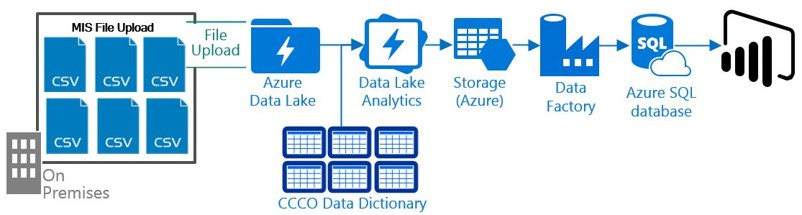
IntePort's California Community College Analytics (CCC Pack)
IntePort’s CCC Pack is a cloud-based custom data analytics solution for the largest educational system in the world: the California Community Colleges (CCC). Specifically designed to harness the data standards of the CCC Chancellor's Office (CCCCO), the Pack automates the deployment of an ETL and data modeling infrastructure in Microsoft Azure PaaS, then auto-processes the raw MIS files utilized by every college in the CCC system to generate robust data models and an incredible range of pre-populated charts and graphs surfaced through Microsoft’s Power BI or Tableau, giving each college the ability to view vast quantities of granular disaggregated data while also facilitating rich custom reporting and self-service service analytics across the vast data points available in the MIS files.